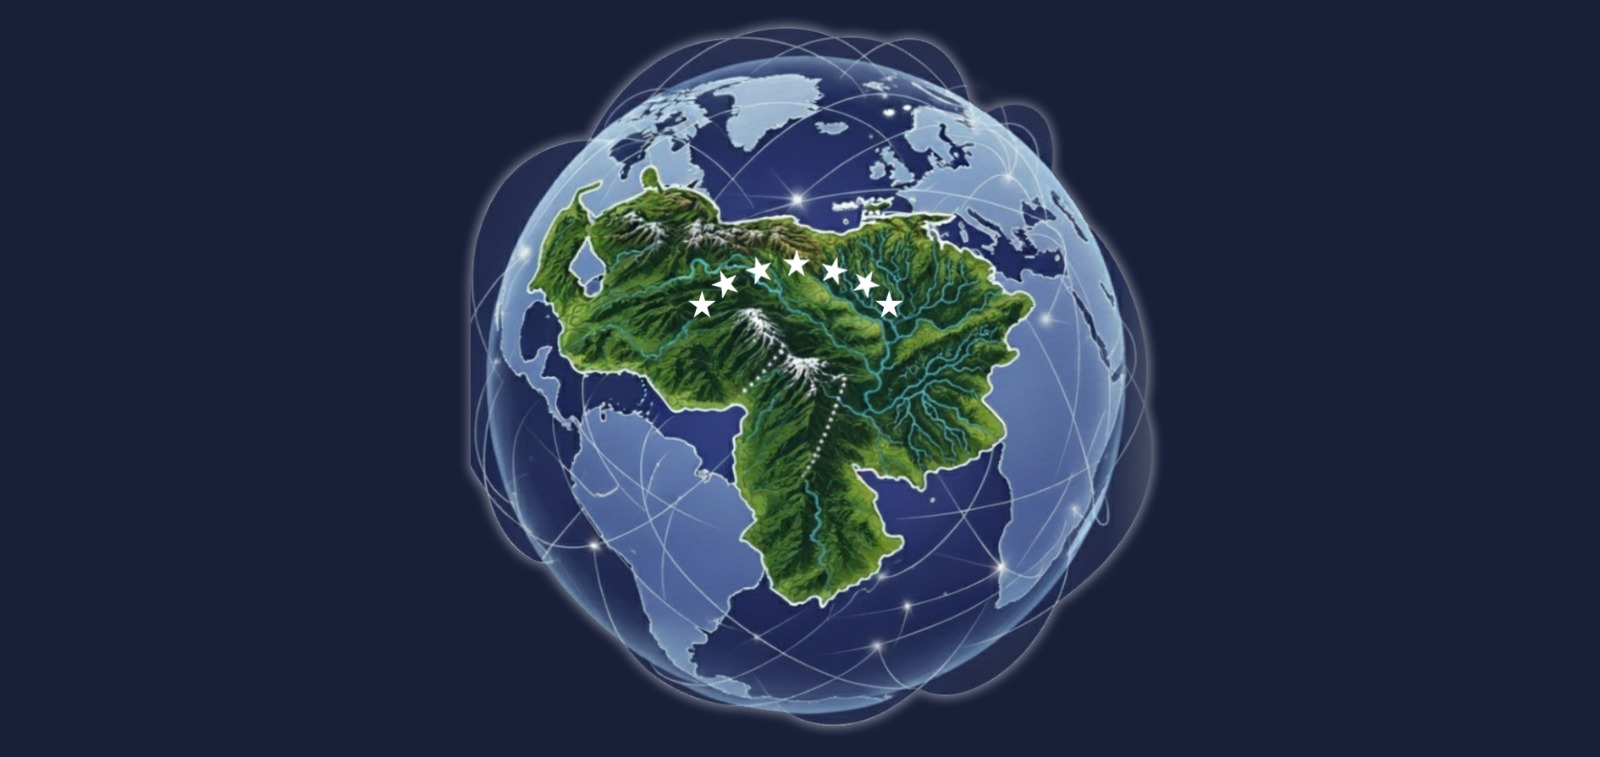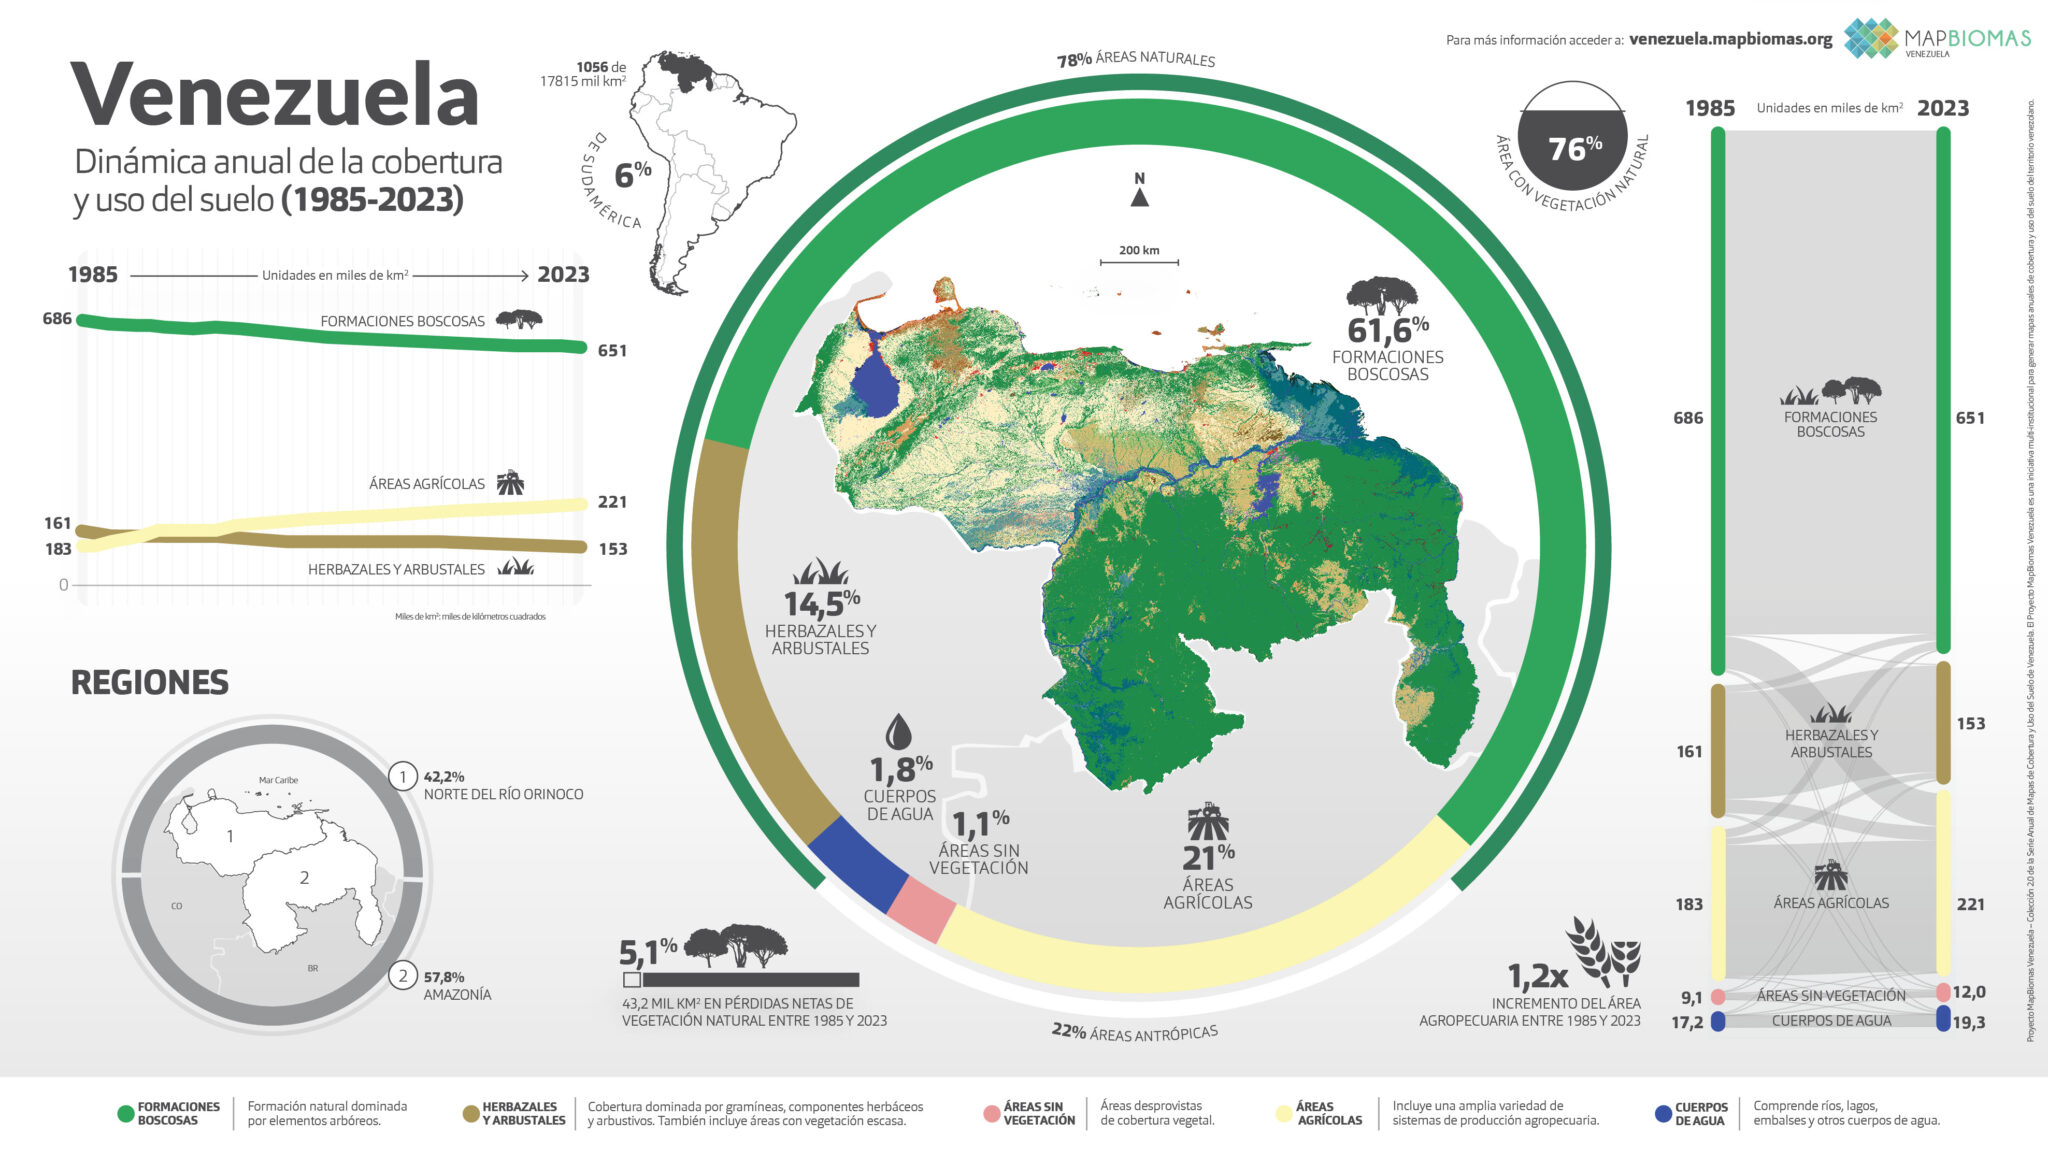
Image Credit: MapBiomas Venezuela Project is a multi-institutional initiative.
Full description: venezuela.mapbiomas.org.
Making Spatial Analysis Accessible
In March 2021, during my participation in a regional remote sensing expert collaborative network, I had the opportunity to share a closer look at our work with colleagues outside the RAISG initiative.
The goal wasn’t to present a complete technical report or methodology exposition, but to translate technical insights into a narrative that could be understood by those not immersed in geography, GIS, or spatial data analysis.
During the pandemic, when we were all remote, fostering connection became a vital organizational resource.
Structuring Information from a Technical Perspective
MapBiomas Venezuela is an interactive tool that monitors land cover and land use changes across the Amazon region. Its strength lies in its ability to integrate satellite imagery, spatial analyses, and automated classification to provide detailed maps of forests, water bodies, agricultural areas, and more.
Back then, we were constructing Venezuela’s section of Collection 3, which extended the previous 1985–2018 analysis until 2020, incorporating new layers such as mining, hydroelectric plants, and roads. Much more has evolved since then.
Behind the data visualization was extensive cartographic processing:
- Landsat image mosaics at 30-meter resolution.
- Data organized into 68 operational regions to facilitate processing.
- Supervised classification using Random Forest in Google Earth Engine.
- Iterative filtering and validations to correct errors and improve final accuracy.
But the real challenge was how to present these technical details in an online meeting—and spark a casual, cross-disciplinary conversation.
To do this, I relied on:
- Visual metaphors → comparing satellite mosaics to a “fabric of data.”
- Applied examples → showing how filtering improved the interpretation of specific areas.
- Dynamic comparisons → contrasting images from different years to illustrate change detection.
The response was positive. Professionals in human resources, administration, agriculture, project management, and other fields engaged with the discussion. Understanding increased, collaboration improved, and contributions became more informed.
Beyond the Data: The Importance of Communicating Science
This experience reaffirmed something fundamental: technical knowledge must be understandable and accessible.
In research and projects, where data can influence conservation and planning decisions, the way we communicate information is as important as the analysis itself.
The session not only showcased the team’s work but also demonstrated the value of sharing knowledge clearly and effectively. Ultimately, data analysis is only useful if those who need it can interpret and apply it.
In my experience as a GIS consultant, I’ve learned that the ability to translate complex data into accessible information is crucial. It’s not just about handling tools and software—it’s about building bridges between technical information and informed decision-making.
Closing Reflection
Making science accessible is not about “simplifying” or losing rigor—it’s about clarity, empathy, and relevance. That’s how knowledge becomes actionable, and how collaboration truly scales.
If your organization needs to transform technical depth into strategic clarity, you can book a Discovery Call for a Spatial Strategy Partnership.
🧭 Continue Reading